You will find the Performance and Options sections on the right side of the Scene view window. Here, you find information on processing time (the time it takes for Composer to render one frame), uptime, errors, and warnings since the application started, etc. The most important thing to keep track of (from a performance perspective) is the processing time. Other KPIs:s and functions are more useful when debugging or tracking issues.
The performance of Composer is dependent on the server hardware. Find more information about tuning your server.
The panel contains two tabs, Performance and Options.
Performance tab.png)
The performance tab contains the most essential information about your project and system performance.
Live Preview
Using the Live Preview feature, you can share your live stream of the Scene view using Vindral CDN. The Live Preview feature aims to make it possible to share your creation with stakeholders, customers, or colleagues. The output of the Live Preview has a limitation of 10 simultaneous viewers and is not designed to broadcast to a broader audience. Contact RealSprint to get access to an unlimited Vindral channel, with global access, for thousands of viewers all over the globe.
Click "Start" to start the Live Preview broadcast. Click "View in Browser" to open up a Vindral QoS player where you can watch the live stream. To share the stream, copy and share the URL of the QoS player.
The Live Preview section is only available if enabled in Settings, and requires a valid production- or evaluation license.
Note:
If the “Render tuning” (Tab "project options") option is active, it is not possible to use the Live preview.
Performance
Below the FPS dropdown, you will see the current processing time (in ms) and an average processing time over the last 10,000 frames. The nominal value represents the number of milliseconds available when rendering a single frame. We recommend that your processing time should not exceed 80-90% of the nominal time. More information on performance can be found in the Performance and Optimization chapter.
Framerate
In the circle's center, you set your setup's frame rate (FPS). To change the framerate, unlock the setting using the Lock icon. Note that inputs will be stopped when unlocking. Restart the inputs after the frame rate has been changed.
For camera inputs (Blackmagic capture), the frame rate must match your project's frame rate.
In general, it is preferred to use media files and input sources that have the same framerate as your project.
The red dot in the top-right corner of the performance indicator appears when the "Processing Queue Length" exceeds 0. This indicates that Composer is "overloaded" and unable to process all frames in real-time.
The available processing time for each frame is dependent on the framerate. A setup running at 50 FPS has 1/50 of a second available for processing (=20ms), while a setup running at 25 FPS has 1/25 of a second available (=40 ms). Using higher frame rates requires more GPU power compared to lower frame rates. The most common frame rates are 50, 29.97, and 25 FPS.
Project Statistics
- Project: Filename of the current running project. If the running project is stored in the Projects folder, the information will only contain the filename (not the full file path)
- Congestive frames: The number of frames where the processing time has exceeded the available time. For example, if the project runs at 50 frames per second, the available processing time is 20ms for each frame. Thus, if the processing time for a single frame exceeds 20 ms, the number of congestive frames will increase. If you have a high number of congestive frames, your system might be overloaded or not optimized.
- Processing queue length: The number of frames waiting in the queue for processing. If the number exceeds 50, Composer will restart the rendering engine, and an error will be logged. In a normal, healthy setup, the processing queue is 0, or close to.
- Max processing time (ms): This property displays the maximum processing time from the last 50 frames.
- Input audio processing (ms): The SUM of all processing time (audio) for all inputs.
- Worker queue flushes:
- Application started: Date/time for application start
- Session started: Date/time for session start
- Session uptime: Uptime since the application was started
- Reported errors: Total errors since the application was started.
- Last error: Date/time and message of the latest error
- Reported warnings: Total warnings since the application was started.
- Last warning: Date/time and message of the latest warning.
- Alarm activated: Date/time when the last alarm was triggered.
- Alarm counter: Number of alarms triggered.
- Alarm cleared: Date/time when last alarm was cleared.
- Alarm active: The alarm has been triggered. Press the button to manually clear the alarm. The alarm will be automatically cleared after the configured time (configured in Settings/Alarms).
- Authorized Api calls: The number of authorized (accepted) Api calls.
- Last authorized Api call: Date/time of the previous API call.
- Open log window - opens the log window :)
CPU and GPU performance
- CPU usage: Current CPU Utilization.
- RAM Usage: Current memory utilization
- GPU Power usage: Current power utilization
- GPU Power usage: Current Power consumption of the GPU
- GPU Power Management: Nvidia "Prefer maximum Performance" enabled
- GPU Power State (0-8): In what Power state is the GPU running in. (0 = fastest, 8 = slowest)
- GPU Utilization: Current GPU Utilization. (This is dependent on the GPU Power state)
- GPU temperature: The current temperature of the GPU. NVIDIA GPUs should typically not exceed 83°C or thereabouts. To achieve maximum boost clocks and the best performance, it is usually beneficial to keep the temperature at or below 60°C.
- NVENC Utilization: NVENC utilization (Nvidia encoding)
- NVDEC Utilization: NVDEC utilization (Nvidia decoding)
- GPU PCIe Link Width: PCIe width determines the number of PCIe lanes that can be used by the GPU for memory I/O. For an Nvidia GPU, it is recommended to use an x16 PCIe slot.
- GPU Memory (Total/Used/Free): Current GPU memory usage: total, used, and free.
Project Options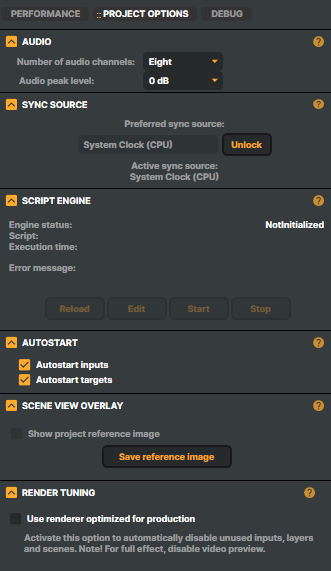
Audio
- Number of audio channels - Defines how many audio channels Composer processes.
- Two (Stereo) (default)
- Eight
- Audio peak level - Specifies the maximum peak level displayed in all audio meters.
- 0 dB (default)
- +3 dB
- +6 dB
- +9 dB
- +12 dB
- +15 dB
- +18 dB
Sync source
The sync source determines which input is used to synchronize the internal rendering clock/timer in Composer. By default, this is set to the System Clock (CPU), meaning Composer operates its internal clock independently of any external inputs. This setting is the most common and works in 99 out of 100 setups. It should only be changed if you're experiencing issues with skipped or duplicated frames.
If you're using camera inputs and need precise synchronization between the camera and Composer, it may be beneficial to sync Composer with an external input. This ensures that timing variations or fluctuations in either the camera or Composer won't cause glitches like skipped or duplicated frames. It's important to note that the primary cause of skipped frames is often system overload, rather than sync source issues.
When a Decklink input is used as the sync source, Composer’s internal rendering clock becomes dependent on the sync source (the camera). Frame processing in Composer is triggered as soon as a new frame is received from the Decklink capture input.
If there are several Decklink inputs, use the Decklink input with audio as the sync source.
Script Engine
- Engine Status - Status of the Script Engine.
- Script - Filename of the script that is running.
- Execution time - Time to execute the script in ticks and milliseconds.
- Error message - Error log message
- Reload button - Reloads the script
- Edit button - Opens the script in the default editor.
- Start - Starts the script
- Stop - Stops the script
More information on the Script Engine can be found here.
Autostart
- Autostart inputs - enable this option to automatically start all inputs when the application is started (or the project is loaded). In most production scenarios, this option should be enabled.
- Autostart targets - enable this option to automatically start all targets when the application is started (or the project is loaded). In most production scenarios, this option should be enabled.
Scene view overlay
Composer offers a built-in feature to create and save reference images of scenes. This enables you to capture and store an image that represents the intended appearance of the scene output.
This feature is especially helpful for alignment or comparing the current setup with the scene's original state when the project was first created.
In live casino studios, where cameras or tables might accidentally be moved, this functionality proves particularly useful.
To use it, simply Save a Reference Image, and activate Show Project Reference Image option.
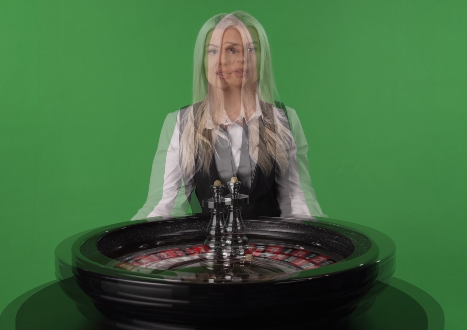
The example above illustrates a scenario where the camera has been slightly moved. By enabling the "show project reference image" option, the changed camera position can be easily detected.
Render Tuning
The Render Tuning option automatically improves system efficiency by managing how inputs are rendered.
When enabled, Render Tuning automatically ensures that only the inputs used in the currently active Scene and scenes with one or more targets are rendered. Inputs that are not part of the active Scene or scenes with a target are temporarily disabled, reducing unnecessary CPU and GPU usage. As soon as those inputs are needed again, Composer automatically re-enables them without any manual action.
This feature can significantly improve system resource utilization in two common scenarios:
- Large or complex projects, where many camera inputs would otherwise consume processing power even when not in use. Especially when running 4K content at a high frame rate.
- Systems with limited resources, where every bit of CPU and GPU capacity counts for stable, smooth performance.
By letting Composer handle this optimization automatically, you gain more headroom for demanding effects, higher resolutions, or additional input sources without overloading your hardware.
Keep in mind that all systems have a limit. While Auto Optimize helps you maximize the potential of your available hardware, system performance ultimately depends on your CPU, GPU, and memory capacity.
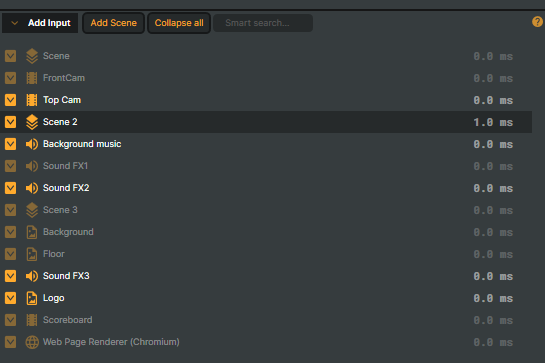
When the Render Tuning option is active, Composer will automatically render only the inputs used in the current Scene, plus inputs used in scenes having one or more targets.
Inputs that are not required for rendering are temporarily disabled and appear dimmed in the interface.
This makes it easy to see at a glance which inputs are actively contributing to the Scene and which are on standby.
By default, Render Tuning automatically decides which inputs should be active to optimize performance. However, each input also includes advanced options that allow you to override this behavior if needed. Please refer to the documentation on Inputs for more information.
These options let you:
- Keep certain inputs active even when they’re not part of the current Scene.
- Manually enable or disable rendering for individual inputs.
- Fine-tune performance for specific workflows or advanced use cases.
For most projects, letting Composer handle Render Tuning automatically will give the best balance of performance and flexibility. Manual overrides are recommended only when you need precise control.
Additional Performance Tips
Beyond the settings covered above, the following resources provide additional guidance on optimizing Composer's performance on your system: