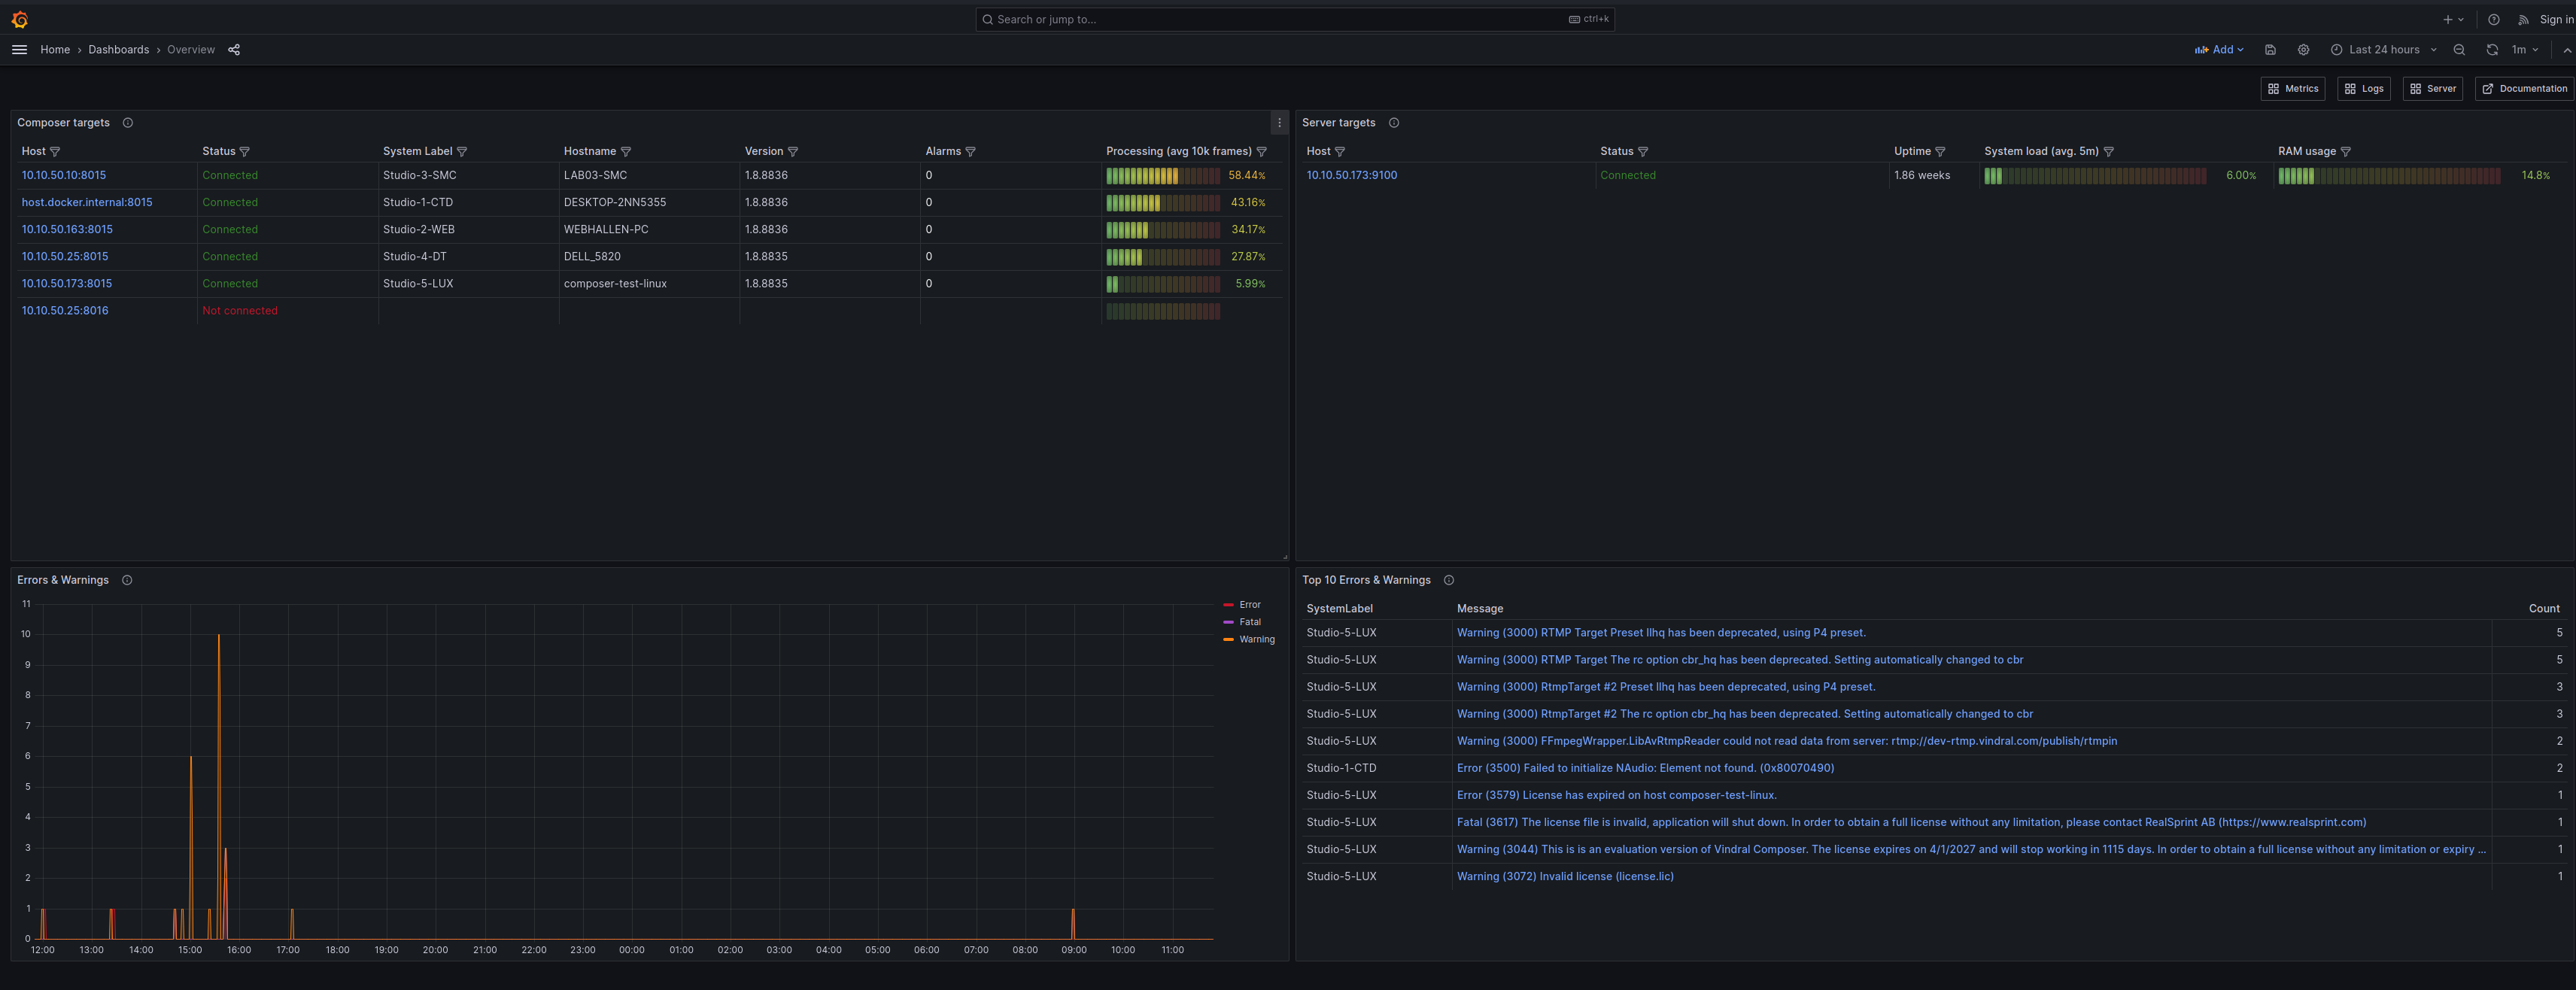
The Overview dashboard (also the default home dashboard when accessing Grafana) shows summarized information regarding alerts, Composer instances, optionally configured Linux server stats as well as log file information.
The purpose of this dashboard is to provide a quick way to see the general health and status of all running targets, especially as an on-site overview on any display.
Alerts
This is a list of configured Alerts. Composer Monitor comes with two predefined alerts - monitoring all specified Composer and Server targets (in composerInstances.yml).
Expand the Alerts to see more information.
Note that Grafana only displays the status of the Alerts. It does not trigger any contact points (refer to Alerts and the Grafana Documentation) unless configured.

Composer targets
This is a list of all Composer targets specified in composerInstances.yml along with
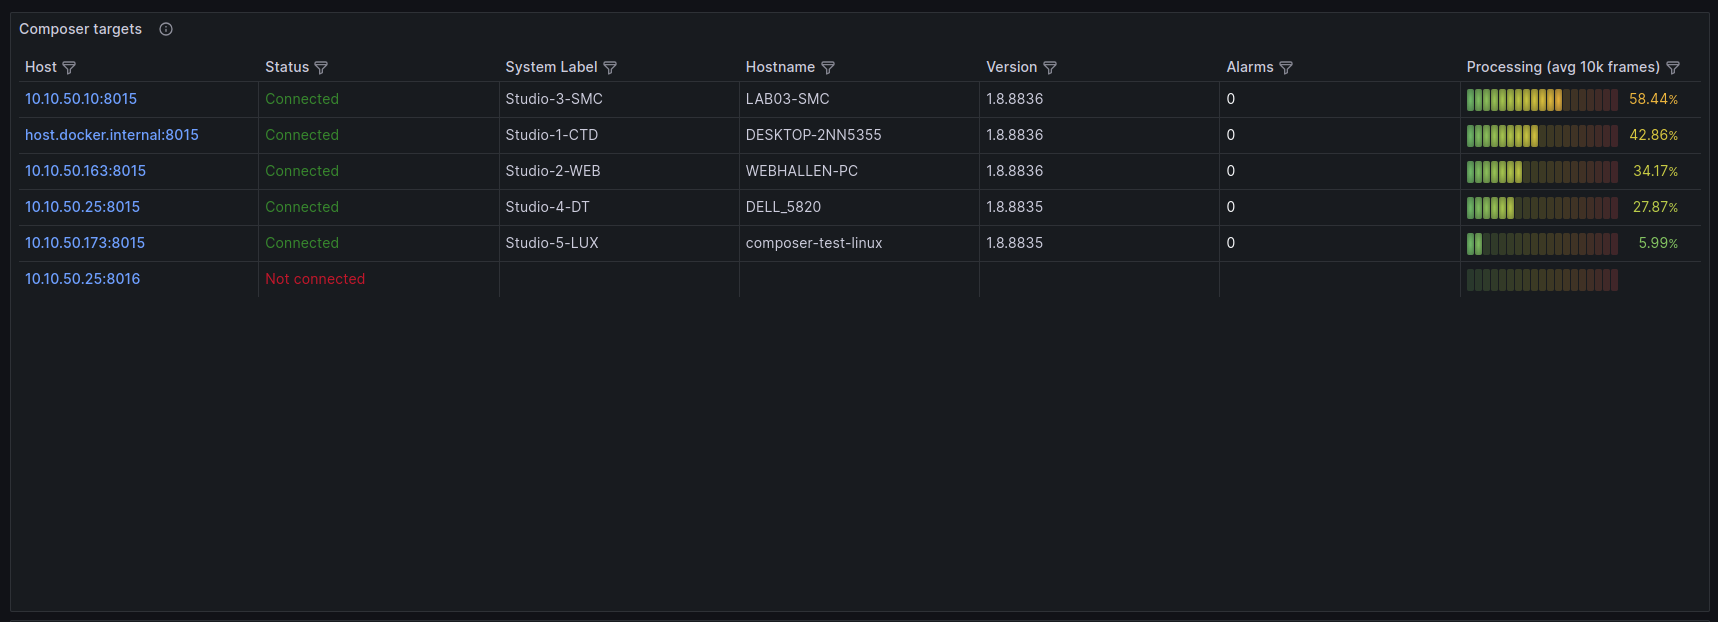
The information in this view is explained in detail below:
| Column | Description | Note |
|---|---|---|
| Host | This is a host/ip target, specified in composerInstances.yml. |
The value is a direct link to the Metrics board for this specific host. |
| Status | Connected - Composer is running and is exposing Prometheus metrics. | |
| Connected (limited) - Composer is running and exposing Prometheus metrics, but does not have a valid license with the extended monitoring plugin | Either purchase the plugin or double check that the license file is applied to Composer. | |
| Not connected - Composer is either not running or does not expose Prometheus metrics on the specified port | Check that Prometheus is enabled in Composer with the correct port. | |
| System Label | The unique system label, set in Composer, used to uniquely identify this specific Composer instance (and allows filtering of metrics and logs) | |
| Hostname | The hostname of the specific host (computer / server) | This is configured on a system level |
| Version | The specific Composer version. | |
| Alarms | Any active Alarms for the specific Composer instance. See | |
| Processing (avg 10k frames) | The average processing usage (as a percentage of available time) as an average over the last 10k frames |
Server targets
This is a list of all the (optional) Linux server targets specified in composerInstances.yml
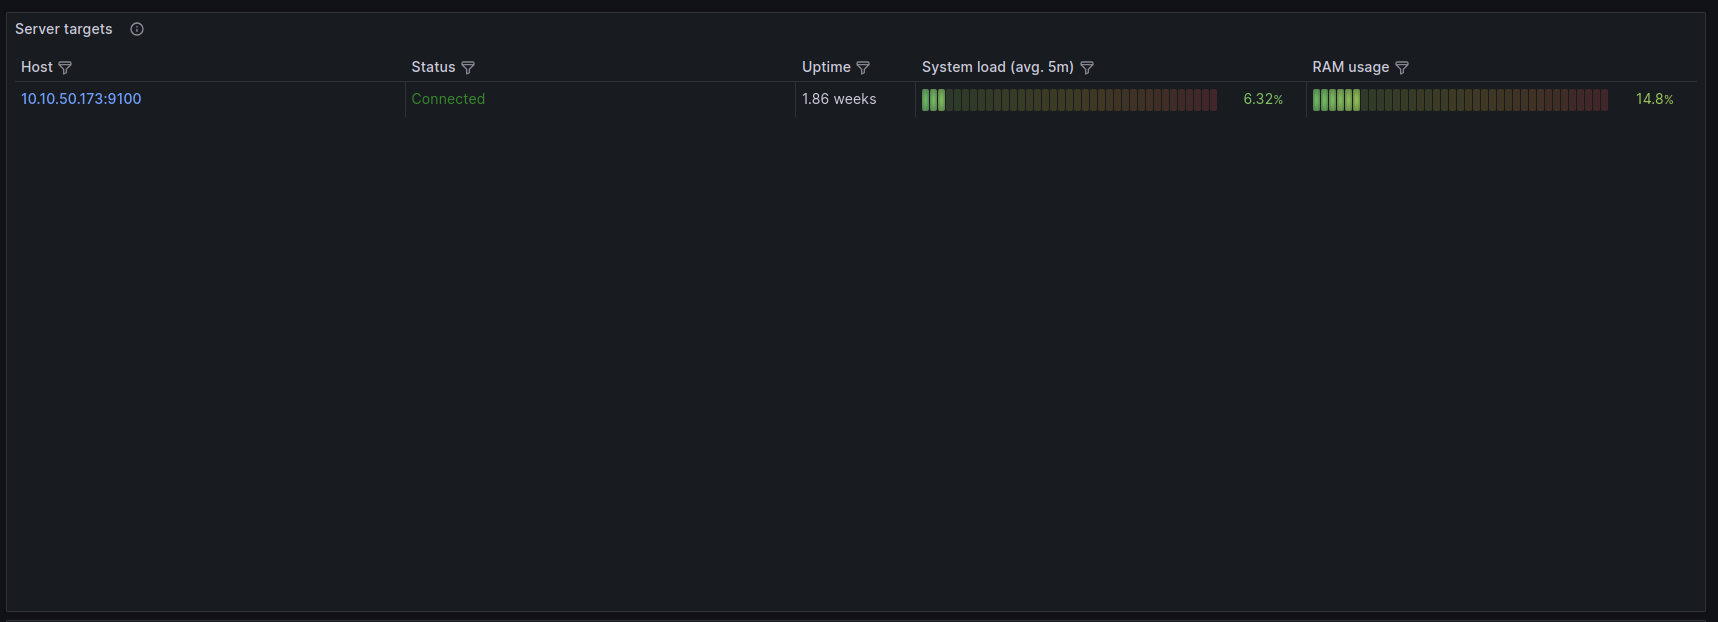
The information in this view is explained in detail below:
| Column | Description | Note |
|---|---|---|
| Host | This is a host/ip target, specified in composerInstances.yml. |
The value is a direct link to the Server board for this specific host. |
| Status | Connected - The server is exposing Prometheus metrics. | |
| Not connected - The server is not exposing Prometheus metrics. | Check that the target is configured correctly and that the server is running the server stats Docker Container. | |
| System Label | The unique system label, set in Composer, used to uniquely identify this specific Composer instance (and allows filtering of metrics and logs) | |
| Uptime | The server uptime. | This is the server's uptime, not the time it has been running the Server stats optional Docker container. |
| System load (avg 5m) | This is the average system (CPU) load over the last 5 minutes for all available cores/nodes. | |
| RAM usage | This is the system's current ram usage (as a percentage of available RAM). |
Errors & Warnings
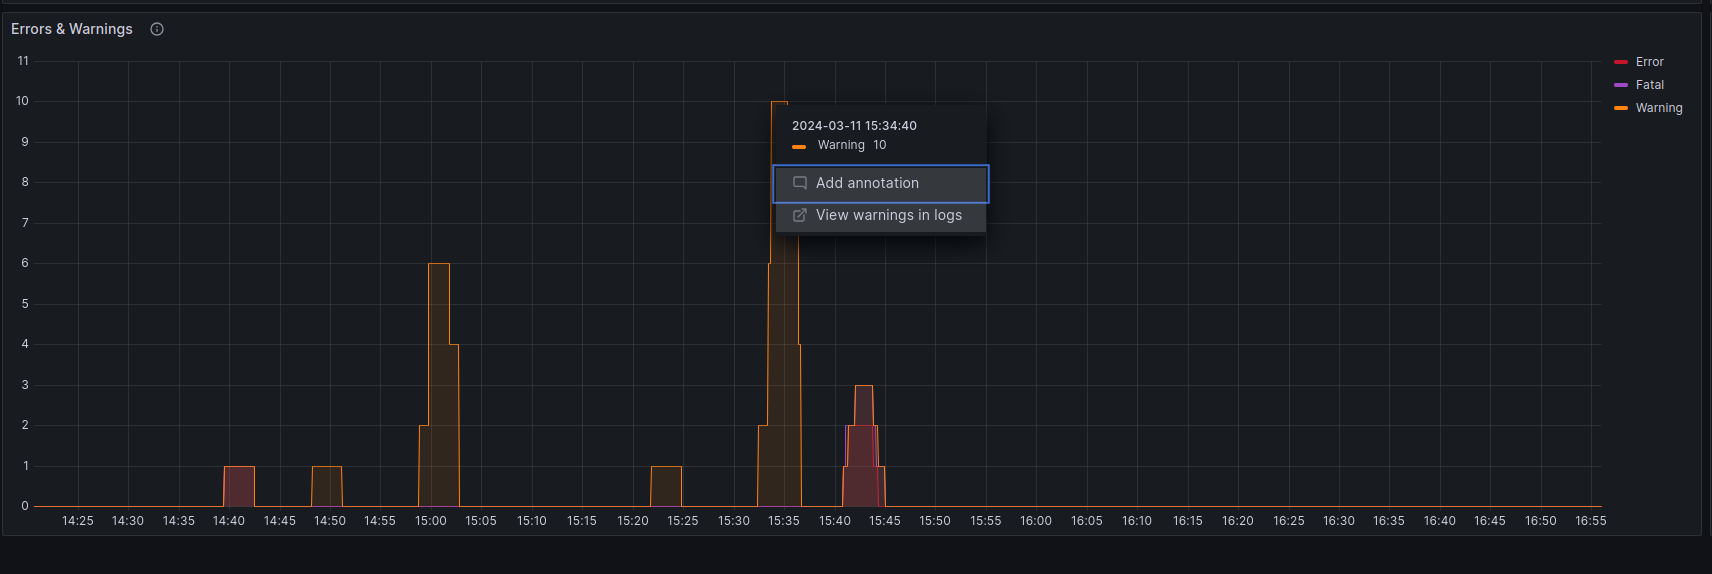
This is a timeline, for the specified timerange, of all the registered Fatal, Error and Warning log events - for all Composer instances.
It is possible to click and drag a specific timerange - directly in the time series - to zoom in / set a new timerange. It is also possible to click on any datapoint and select View <Log Level> in logs (where log level is either fatal, error och warning) to jump directly to the Logs dashboard and see the selected entries directly.
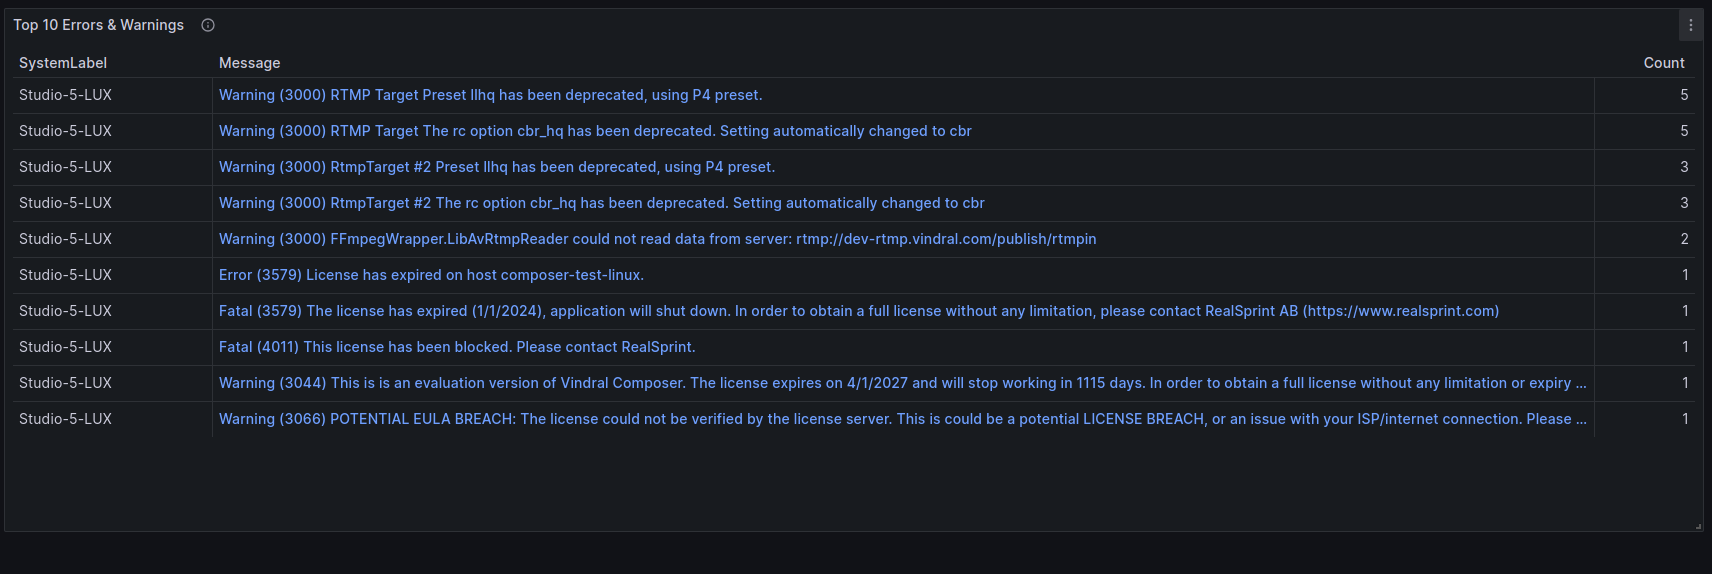
Top 10 Errors & Warnings
This view will extract all errors and warnings, aggregate and count the, to provide a direct overview of the events for the specified timerange.
Each entry is a direct link to the logs dashboard and this specific entry (all of the occurences, if more than one).
