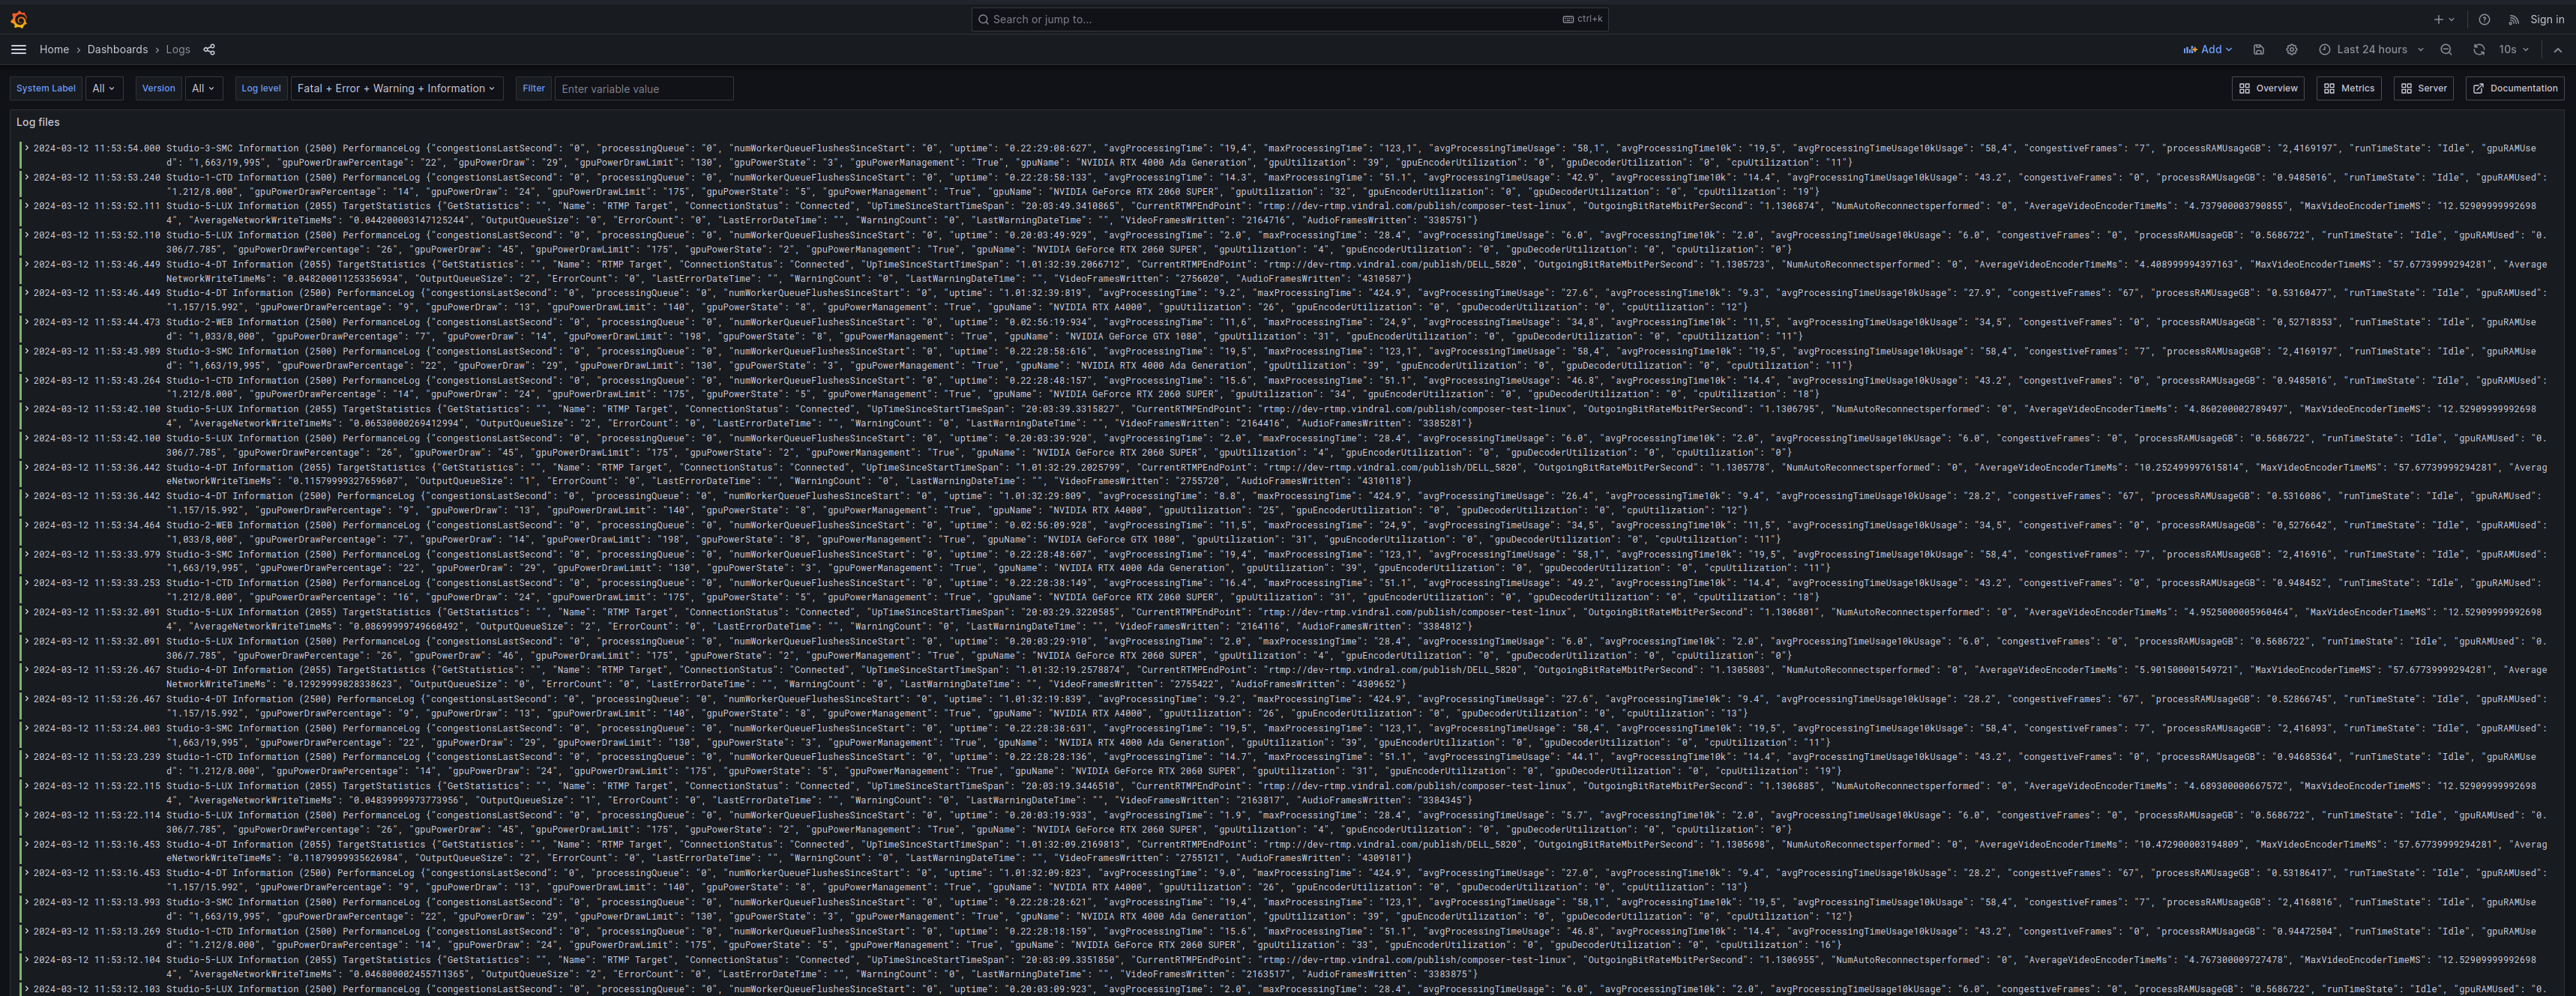
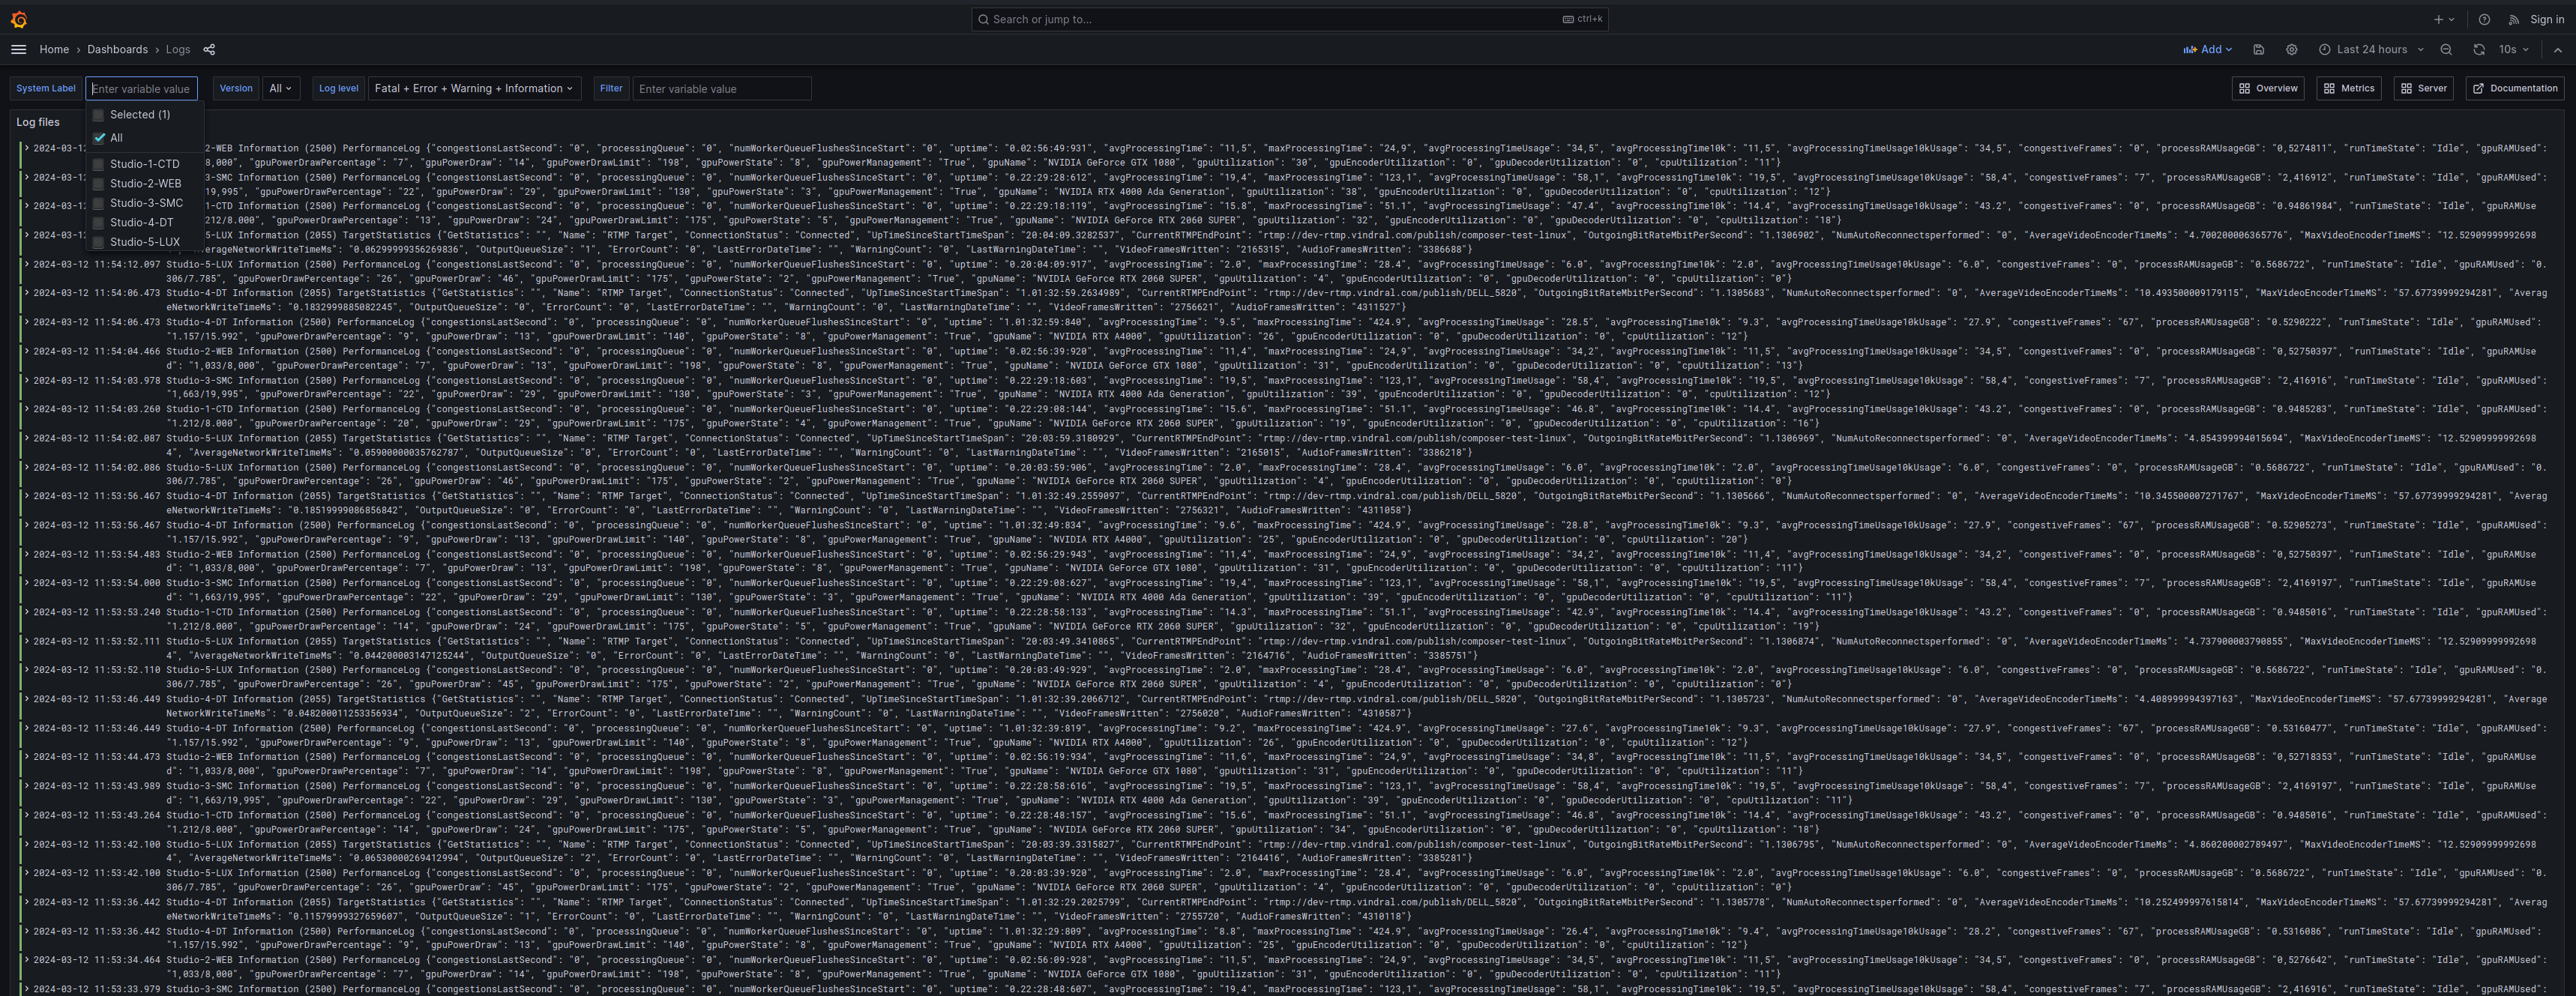
The Logs dashboard centralizes log files from all connected Composer instances, allowing for easy overview and filtering.

Filters
By default, all log entries - from all connected Composer instances - are shown.
Use the filters described below to filter and search the log entries.
All filters can be applied in conjunction, filtering is done left to right.
| Filter | Description | Type | Note |
|---|---|---|---|
| System Label | Filters log entries based on the unique identifier for a Composer instance (set in Composer) | Multi-select | Note that ALL system labels that have log files for a specific time range are available, even if a specific instance is currently not running |
| Version | Filters log entries based on the Composer instance version | Multi-select | |
| Log Level | Filters log entries based on the log entry's level | Multi-select | Note that selecting Error for the log level is much faster than using the free-text filter to search for all entries containing the word "Error". |
| Filter | Filters log entries by a free-text search | Free-text | Please note that certain reserved characters for example ' (apostrophe) can not be used, due to limitations on how text is stored and processed in Grafana variables. Also note that the search is case sensitive. Press enter after entering the text to perform the search. ) |
| Time range | Filters log entries based on a time range | Datetime | For optimal performance - it is recommended to use the shortest applicable time range when searching/filtering log entries. |
Performance
Having many Composer instances connected will produce a lot of log entries. As the number of entries grows - so does the time it takes to filter and search through them.
To ensure the best possible performance, please be adviced to:
- Always apply all applicable filters before performing a text-based search (
Filter). - Always apply the shortest applicable time range to reduce the number of log entries to process.
- Use the Overview dashboard to go directly to a set of log entries for a specific warning/error if applicable.
Combining filters - an example
As all filters can be combined. The filtering is done "left to right", i.e first based on System Label, then Version, then Log Level and finally with free text Filter.
Assume there is an issue with the license on the Composer instance with System Label "Studio-5-LUX".
Start by filtering on System Label: Studio-5-LUX


Filter by Log Level: Warning

Then finally, apply the free-text search license.

The remaining log entries all correspond to Warnings regarding license for the specific Composer instance named Studio-5-LUX.