There are no metrics
- Ensure that
composerInstances.ymlis correctly specified. Please refer to the Installation instructions. - Ensure that the host running Composer Monitor can access each target specified in
composerInstances.yml
For example, assume a composerInstances.yml that looks like this:
- targets: [
  "http://host.docker.internal:8015",   # Gather metrics from THIS host.
  "http://20.20.50.1:8015",             # Gather metrics from 20.20.50.1.
  "http://20.20.50.2:8015",             # Gather metrics from 20.20.50.2.
]
Then from the host running Composer monitor make sure it can access each of these target's Prometheus endpoint, set in Composer. In this example, navigate your browser to:
http://20.20.50.1:8015/metrics
http://20.20.50.1:8015/metrics
Each endpoint should return Prometheus data:
# HELP composer_frames_processed_total Total number of processed video frames.
# TYPE composer_frames_processed_total gauge
composer_frames_processed_total{label="linusmah",version="1.8.8822",hostname="linusmah"} 32400
# HELP composer_congestions_last_second
# TYPE composer_congestions_last_second gauge
composer_congestions_last_second{label="linusmah",version="1.8.8822",hostname="linusmah"} 0
...
If not - the specified target's Prometheus port is not available. Please check firewall and other network-related settings.
There are only partial metrics
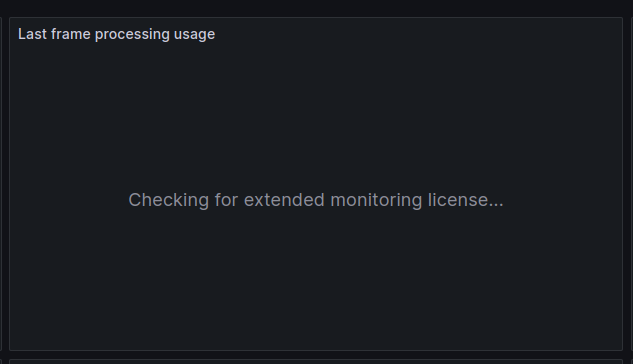
If some metrics show and are updated while others are not or looks like this

that either means:
- That you have not purchased an extended monitor license or
- One or more hosts running Composer has not been supplied your (updated) license with Extended Monitoring capability.
Double check the license file in the Composer folder on the Composer host, that it contains the right plugin:
"PluginLicenses": [
    {
      ...
    },
    {
      "Name": "Extended Monitoring",
      "ClassName": "",
      "MaxInstances": 1,
      "LicenseKey": "a-license-key..."
    }
It says Extended Monitoring disabled
If the Composer instances overview dashboard in Grafana, where each configured target in composerInstances.yml is shown, specifies that one or more Composer instances has the Extended Monitoring plugin disabled:

Then
- You have not purchased an extended monitor license or
- One or more hosts running Composer has not been supplied your (updated) license with Extended Monitoring capability.
Double check the license file in the Composer folder on the Composer host, that it contains the right plugin:
"PluginLicenses": [
    {
      ...
    },
    {
      "Name": "Extended Monitoring",
      "ClassName": "",
      "MaxInstances": 1,
      "LicenseKey": "a-license-key..."
    }
There are no log files
Composer (Desktop and Runtime) must be configured to send log files to Composer Monitor.
- Double check the settings, as specified in the Installation article.
- Double check that the host that is running Composer Monitor exposes the port
3100.
Something is weird after updating
Composer Monitor must be restarted after updating, for the new settings / changes to be applied.
Depending on how Docker was setup on the host, use either command below that works:
docker compose restart
or
docker-compose restart
I have made changes in dashboard X but they are reverted
Composer Monitor will read and use the dashboards as defined by the json files in the Dashboards folder.
Any changes are only stored locally while Composer Monitor is running. Restarting will re-construct the Dashboards from the json files.
To persist the changes - refer to the Customize and extend Composer monitor article.
I have found a bug or have an idea
We are always happy to receive feedback or hear ideas. Contact RealSprint via info[at]realsprint.com.