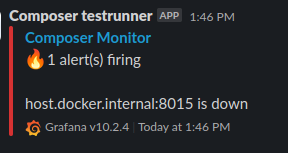
Composer Monitor comes pre-built with provisioned alert configurations including two Alerts and a Slack contact point template.

These alerts are shown on the home dashboard.
Composer instance down
This Alert will trigger if a Composer instance target (as specified in composerInstances.yml) is not responding (sending Logs or Metrics) for at least 1 minute.

Server instance down
This Alert will trigger if a Server instance target (as specified in composerInstances.yml) is not responding (sending Metrics) for at least 1 minute.

Configure Slack contact point
Set the webhook URL in config/alerts/contactPoints.yaml to enable sending notifications to Slack.

Requires a Slack app
Customizing built-in alerts
Feel free to customize the built-in alerts in the config/alerts folder. Please refer to the Grafana Documentation.
Remember to restart Composer Monitor after making changes to the provisioned alerting resources.
Extending Alerts
Feel free to add more Alerts. Keep in mind that the Composer Monitor pre-built Alerts can not be modified via Grafana as they are provisioned via the alerts yaml files. Any additional rules can be created and managed with Grafana - but are only stored locally (if not exported and added to the yaml configuration files).
Refer to the Grafana Documentation.