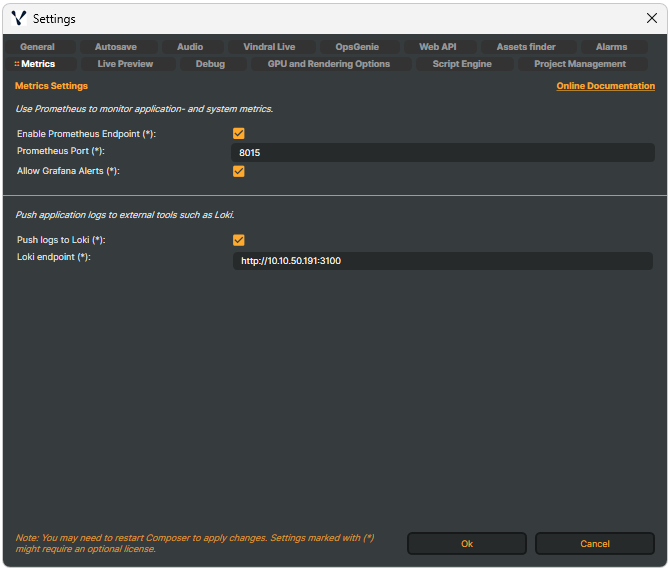
A Prometheus endpoint is a URL that exposes performance metrics of a service or application, like CPU usage or memory utilization, collected by an external system supporting the Prometheus metrics format. Once the data is exposed via the endpoint, an external tool such as Prometheus can collect and store the data for analysis, visualization, and alarms.
- Enable Prometheus Endpoint* - Toggle on/off. After enabling the "Enable Prometheus Endpoint", it is advised to restart Composer.
- Prometheus Port* - Network port to use.
- Allow Grafana Alerts* - If activated, the metric composer_ext_allow_grafana_alerts will be set to 1. This can be useful when configuring Grafana Alerts as the setting can be read by Grafana, making it possible for the Composer user to control whether Grafana Alerts should be activated (for this particular Composer instance).
- Push logs to Loki* - If enabled, Composer will push log files to Loki endpoint specified.
- Loki endpoint* - Url for Composer to push log files
Runtime version:
To enable metrics or push logs in the runtime version, in the settings.xml (root folder of the Composer application) set the following variables:
Prometheus:
"EnablePrometheus": true
"PrometheusPort": 8015 (default setting)
Loki logs:
"EnablePushLogsToLoki": true,
"LokiEndPointAddress": "http://localhost:3100"
To connect to the Prometheus Endpoint, use the server IP or connect to localhost: http://localhost:8015/metrics
Metrics are updated every 4th second.
Composer-specific metrics:
- FramesProcessed (composer_frames_processed_total)
- CongestionsLastSecond (composer_congestions_last_second)
- NumCongestiveFramesSinceStart (composer_congestive_frames_since_start)
- ProcessingQueueSize (composer_processing_queue_length)
- LastProcessingTime (composer_last_frame_processing_time)
- MaxProcessingTime (composer_max_processing_time)
- AverageProcessingTime (composer_average_processing_time)
- CpuRamUsage (composer_cpu_ram_usage)
- GpuRamUsage (composer_gpu_ram_usage)
- FatalCount (composer_fatal_error_count_total)
- ErrorCount (composer_error_count_total)
- WarningCount (composer_warning_count_total)
Additional metrics will be updated if you have licensed the Extended Monitoring Plugin. Find more information here: Extended Prometheus Metrics.