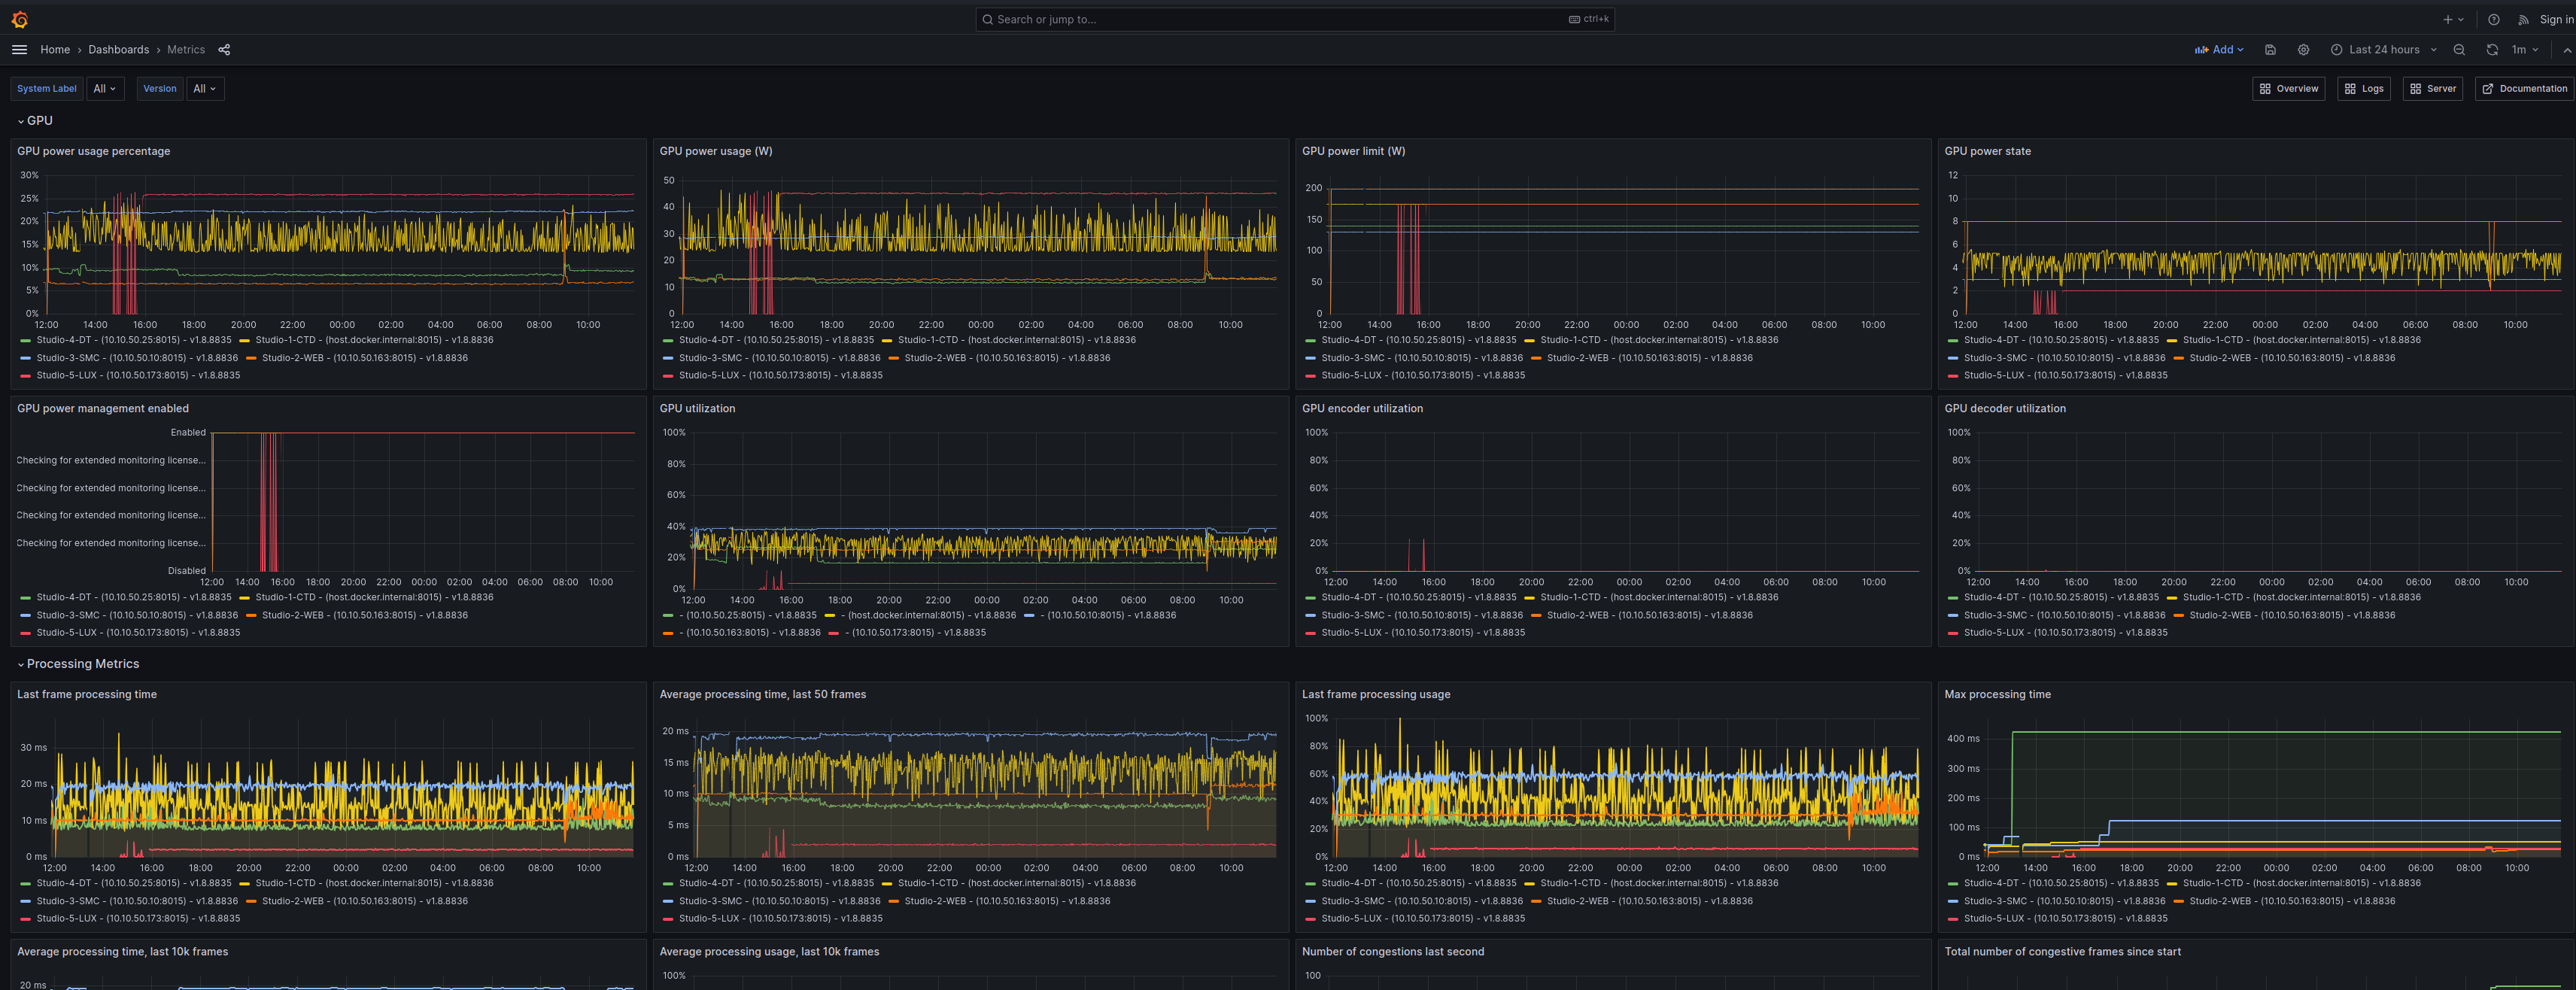
The Metrics dashboard centralizes Prometheus metrics from all connected Composer instances, allowing for easy overview and filtering.

Metrics
Please refer to Extended Prometheus Metrics for an overview of all available metrics.
Filters
By default, all metrics - from all connected Composer instances - are shown.
Use the filters described below to filter and search the metrics.
All filters can be applied in conjunction, filtering is done left to right.
| Filter | Description | Type | Note |
|---|---|---|---|
| System Label | Filters log entries based on the unique identifier for a Composer instance (set in Composer) | Multi-select | Note that ALL system labels that have metrics for a specific time range are available, even if a specific instance is currently not running |
| Version | Filters log entries based on the Composer instance version | Multi-select | |
| Time range | Filters log entries based on a time range | Datetime | For optimal performance - it is recommended to use the shortest applicable time range when filtering the metrics. |
Using the filters - an example
All filters can be combined. The filtering is done "left to right", i.e first based on System Label and then Version.
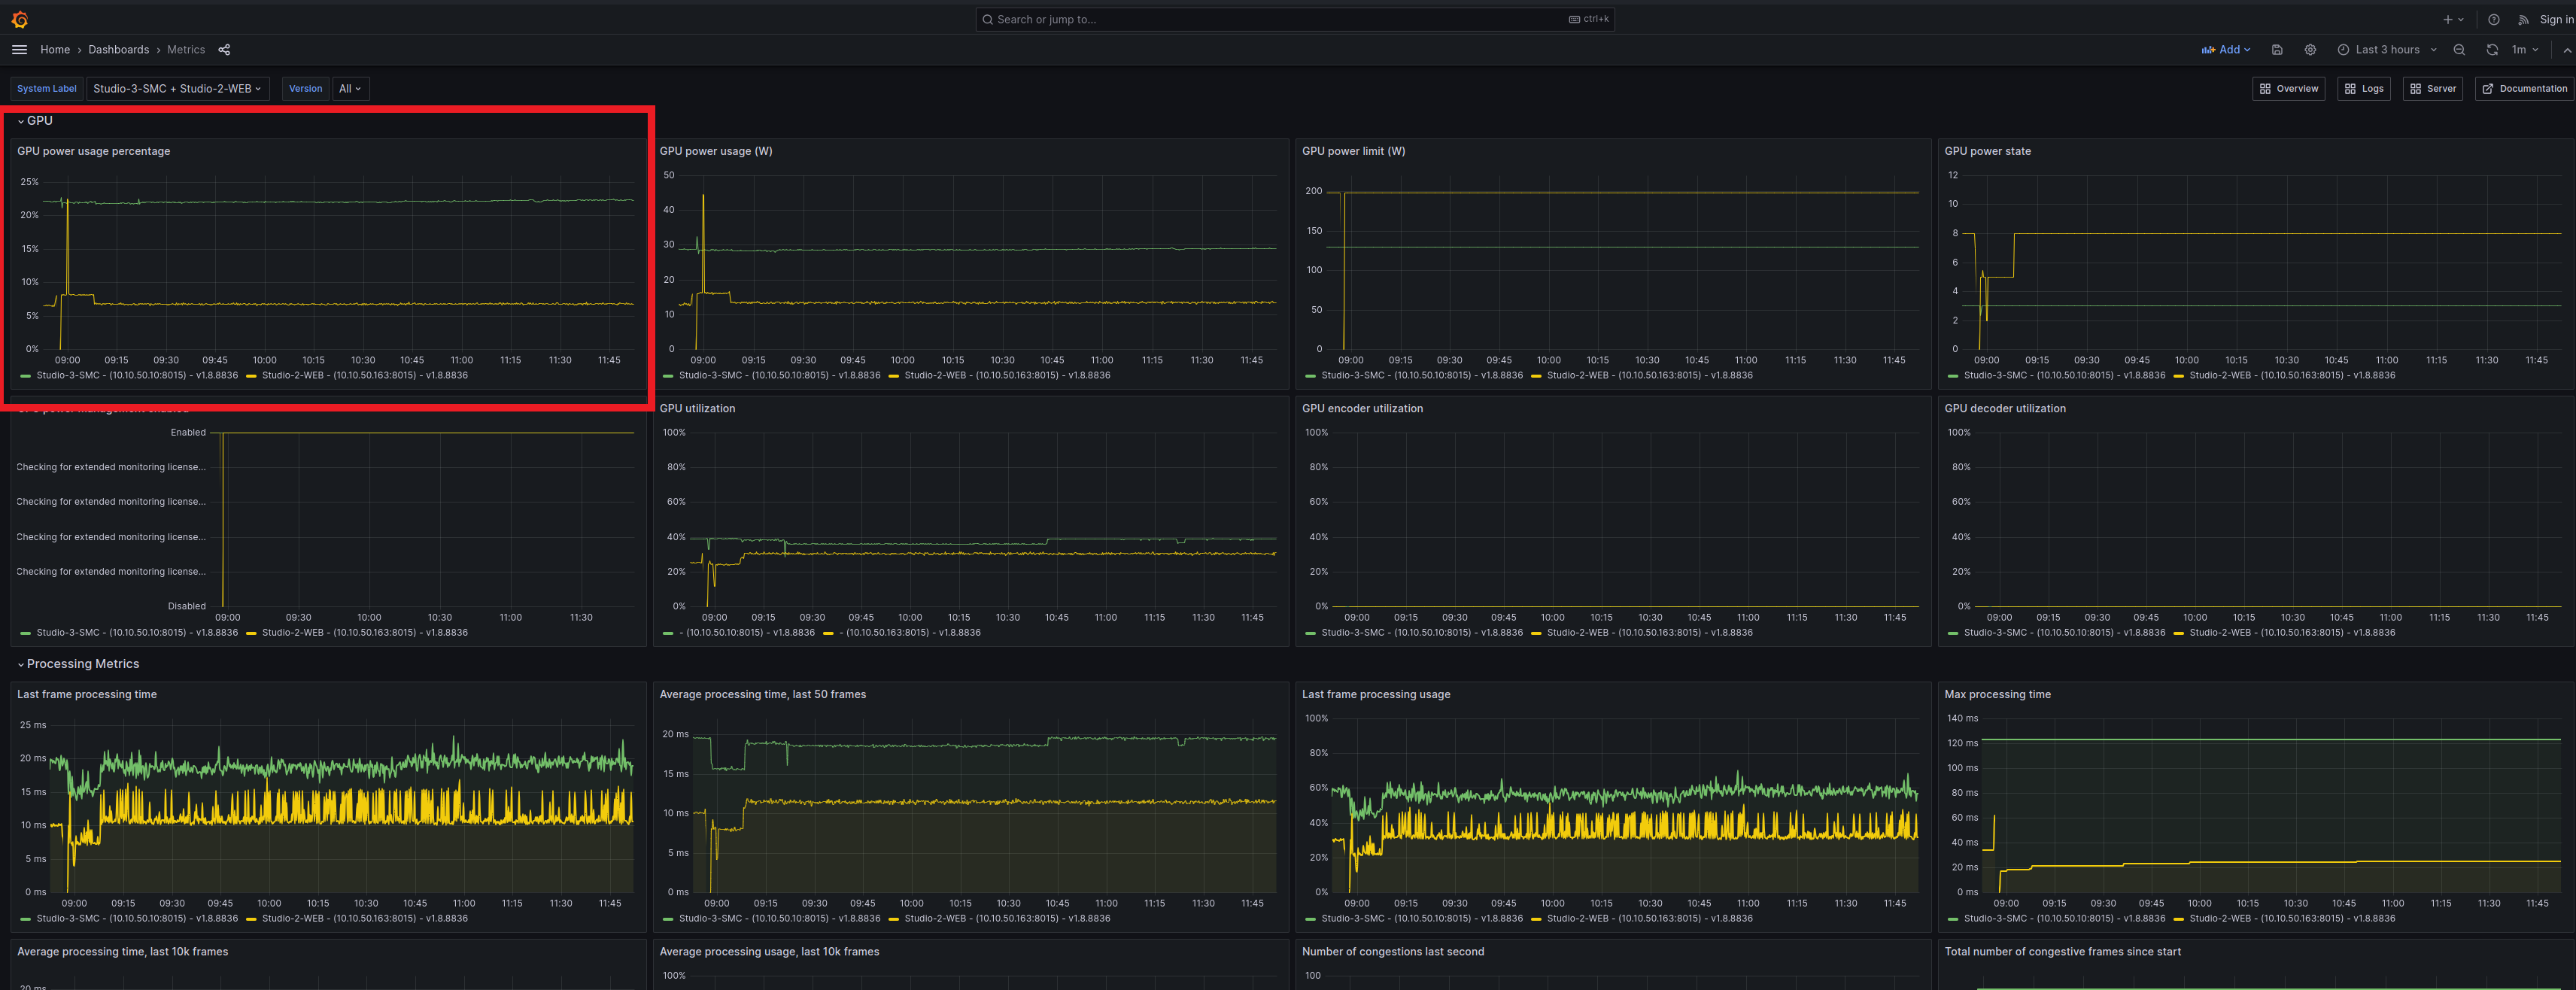
Assume we want to compare the CPU power usage percentage of two Composer instances with system labels
Studio-3-SMCStudio-2-WEB.
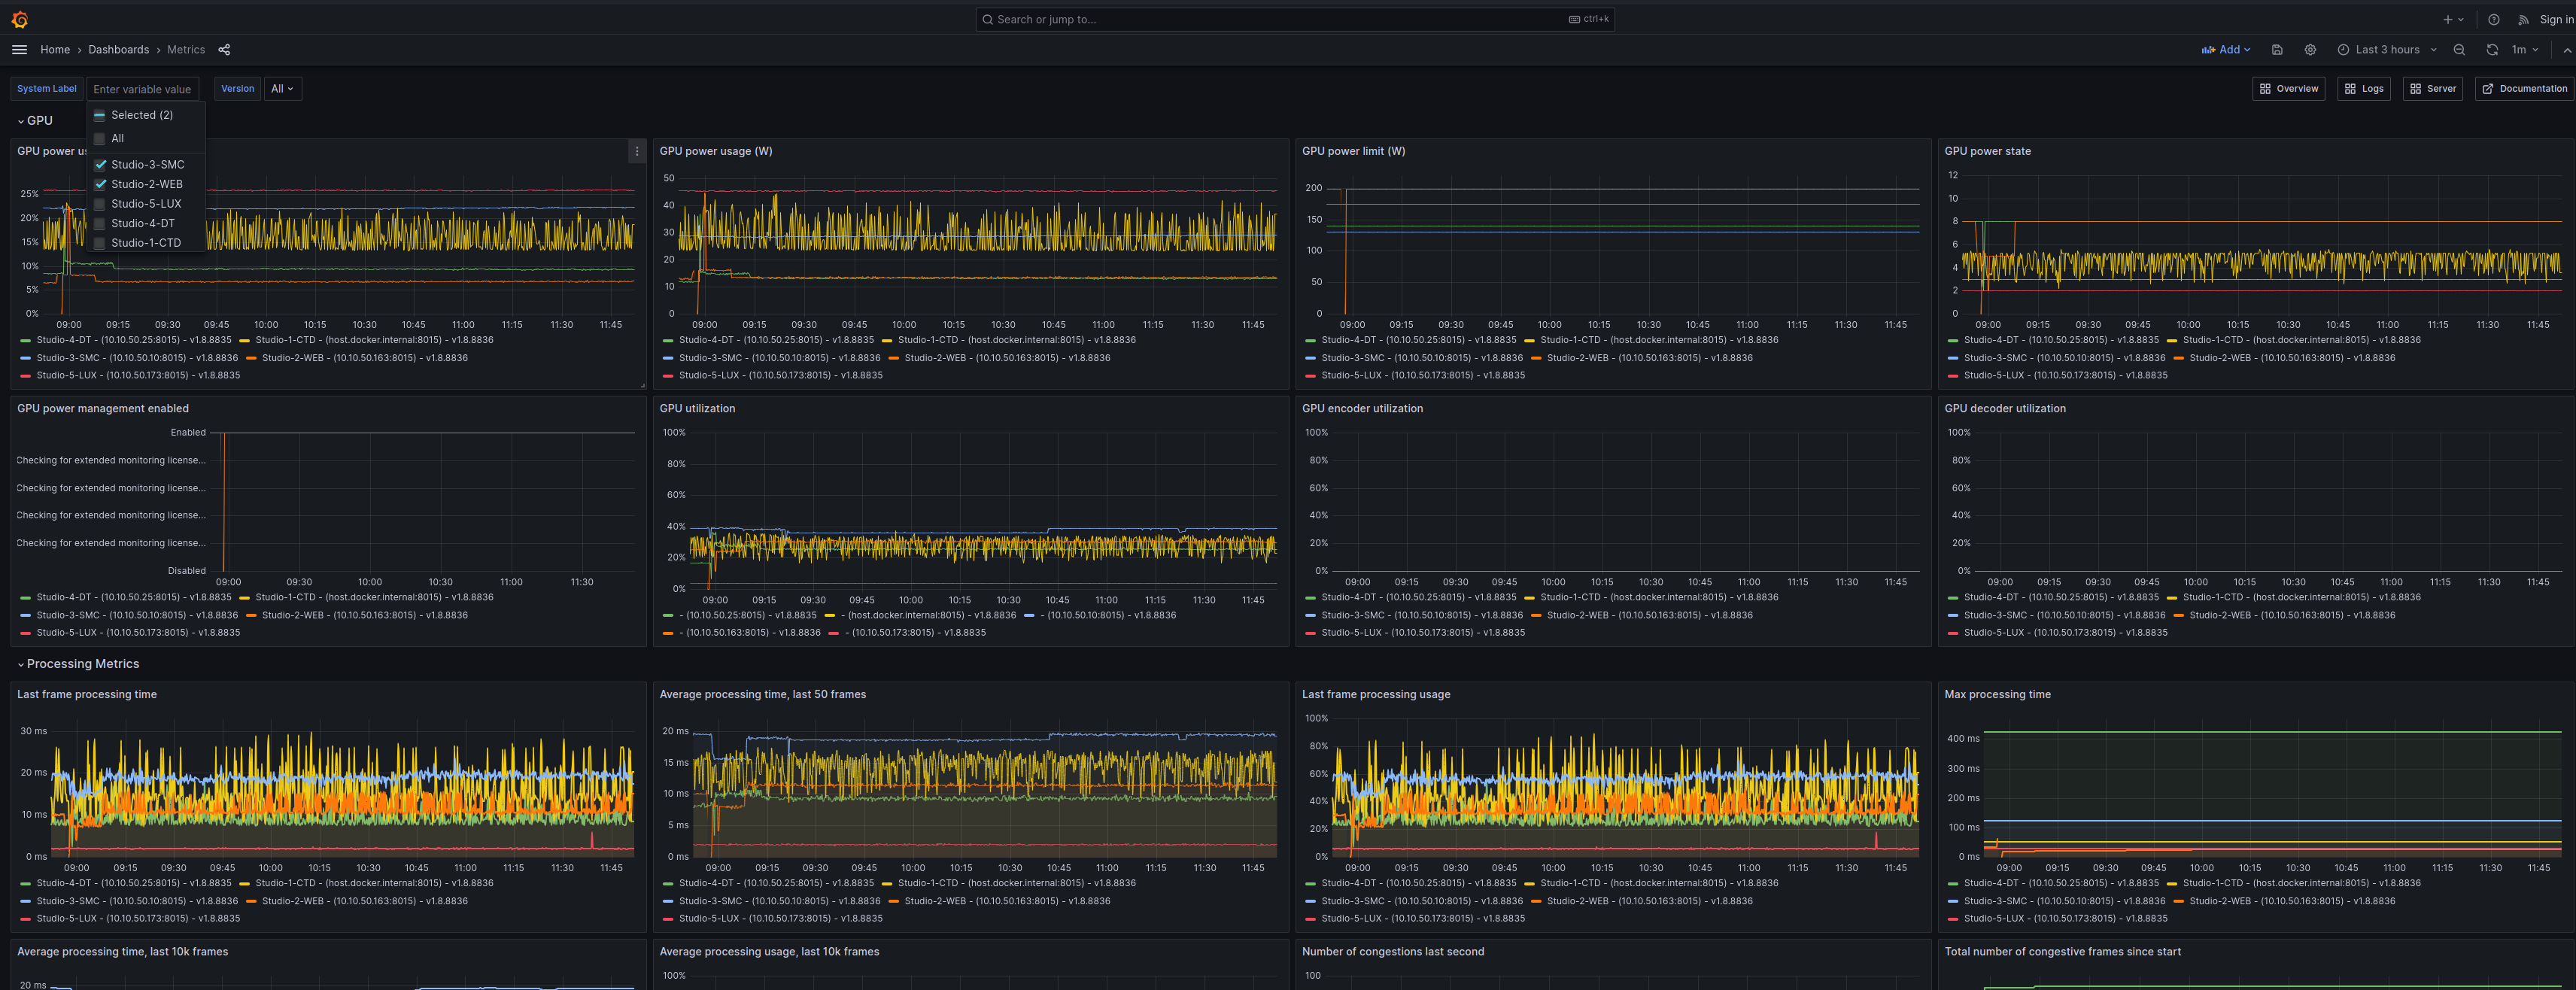
Start by filtering on System Label and select both Studio-3-SMC and Studio-2-WEB


For this example, we can leave Version: All - since it is irrelevant.
The resulting view makes it easier to analyze and compare.

Assuming something interesting happened at this point, it is possible to:
- Click and drag to highlight a section in the timeseries - setting the timerange - to give a "zoomed in-view".
- Check the logs for anything unusual (click the
Logsshortcut button in the top right to go directly to the Logs dashboard with the filters preserved)

- If server stats are enabled for the hosts - Click the
Servershortcut button in the top right to go directly to the Server dashboard.
