This website contains old documentation. The new documentation can be found at https://composer-docs.vindral.com/.
The new documentation contains more information for both users and developers.
Since Composer Monitor is delivered with configuration files in a compressed archive - and will received future updates - it is important to understand how to make changes and additions.
Changing the dashboards
Note that all dashboards are populated from their corresponding json file in the dashboards folder. Any changes made must be persisted by overwriting the contents of these files as restarting the Composer monitor system will re-populate from these files.
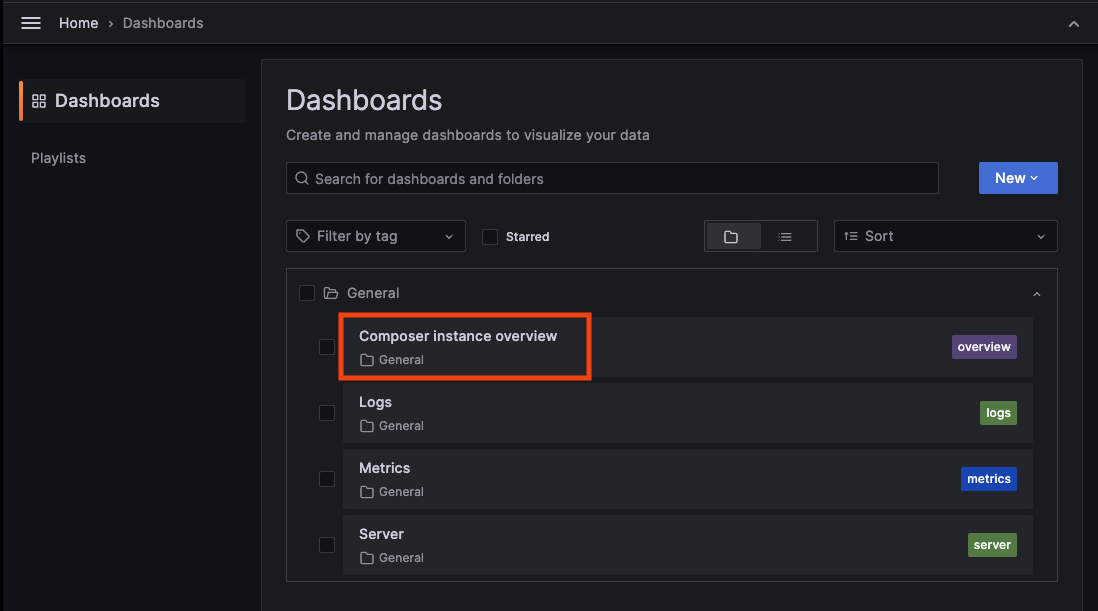
Composer Instances Overview is set as the default dashboard. It is read-only and populated from the dashboards/overview.json file.
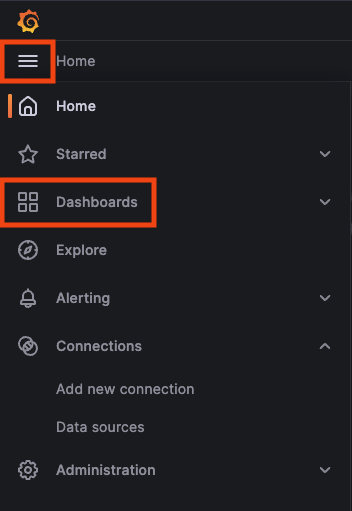
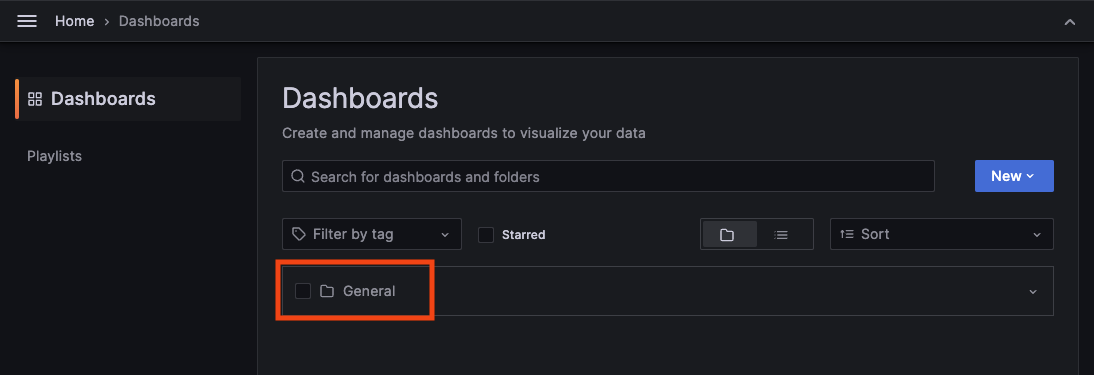
To modify (add, rearrange, delete, etc) any dashboard - go to the Dashboards section in the menu and select the General folder.
Select the dashboard to modify. For example
- Make any desired changes.
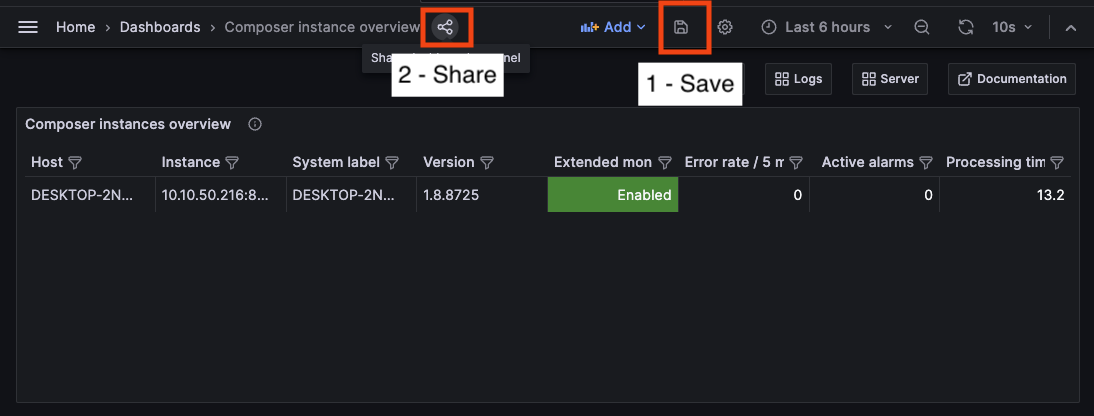
- Save the dashboard.
- Click the
Share dashboard or panelbutton next to the Dashboard breadcrumb (upper left).
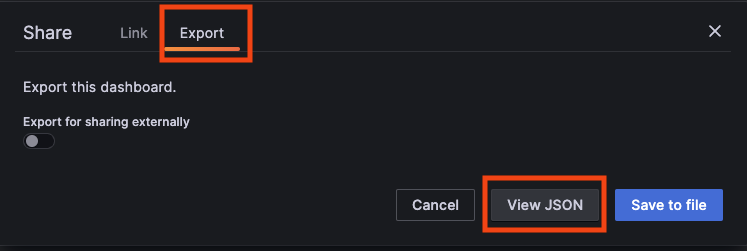
- Choose the
Exporttab. - Click the
View JSONbutton. - Click the
Copy to Clipboardbutton.
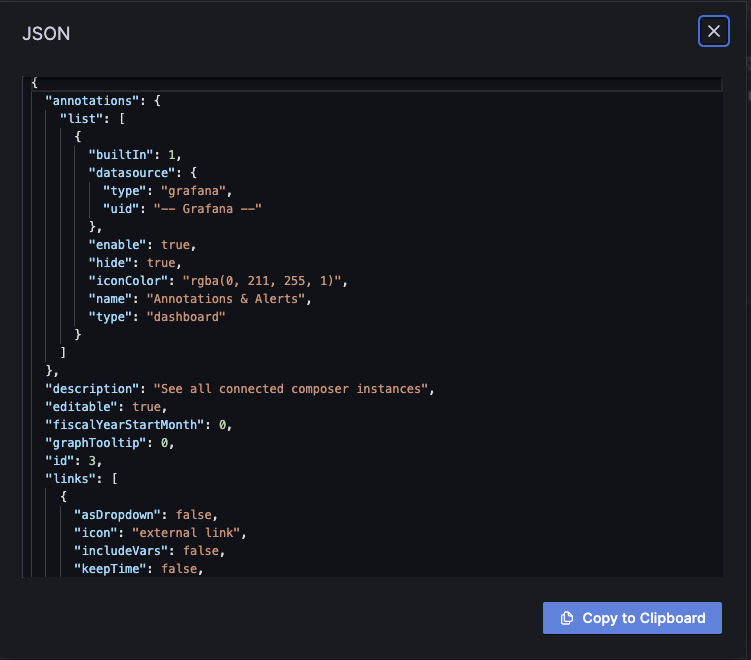
- Paste the JSON content into the associated dashboard configuration file and save it.
- It is now saved locally (while Composer Monitor is still running the application) and upon restart - it will read the updated configurations.
The changes will be saved instantly when saving. The export mechanism is only used to ensure that the changes are persisted for application relaunches. Any changes not exported and overwritten to the corresponding dashboard files will be lost upon application relaunch.
Adding new dashboards or features
Adding new dashboards or features
If you want to add a new dashboard, create it from the menu.